 LinkedIn profiles are one of the most important components of an executive’s personal online brand. When managed with intention, they build visibility, authority, and credibility with senior decision-makers, which strengthens confidence during active sales cycles and improves the likelihood of winning qualified opportunities. Maintaining a strategic presence also opens the door to partnership and collaboration. However, if you’re measuring success with the platform’s native metrics, you’re not getting the whole picture. In fact, you might even believe your strategy is underperforming when it’s actually working well or, worse, be lulled into a false sense of security because you’re seeing lots of engagement on your posts.
Thankfully, you can move beyond LinkedIn vanity metrics and gain a greater understanding of your presence, and you don’t need specialized software to make it happen. You just need to convert the data the platform gives you into more meaningful insights.
In this guide, we’ll explore LinkedIn profile metrics that focus on quality, relevance, and influence rather than vanity indicators, so you can reliably gauge the impact of your personal LinkedIn presence and track progress over time.
Use LinkedIn’s Native Informational Insights to Evaluate Trends, Not Performance
Before I break down the metrics you should be using to gauge your presence, let’s start by taking a look at some of the data LinkedIn already provides you with. These indicators provide useful context, illustrate overall activity trends, and can be reviewed regularly to support interpretation. However, they should not be used to measure performance, as they fluctuate heavily based on posting frequency, topic type, and audience behavior.
Profile Views
This provides a general sense of how many people are visiting your profile. Variations often reflect posting cadence or topic relevance, so this metric provides context but is not tied to performance evaluation.
Content Impressions
Content impressions show total visibility across posts. Because impressions increase or decrease based primarily on the number of posts published, they should be tracked as a reference only. In just a moment, we’ll explore the content efficiency score (CES), which corrects for this.
Follower Growth
Your follower growth offers insight into audience expansion, but naturally slows as the audience gets larger. It’s also strongly influenced by how often content is posted. For true performance measurement, you’ll want to use the follower conversion ratio, which will also be covered below.
Published Posts
Tracking the total number of posts published each month provides long-term visibility into posting volume and consistency.
Top-Performing Posts
Your top-performing posts are comprised of content that resonated the most strongly with your audience. Reviewing them is helpful for content planning, but individual post virality or topic spikes make them a poor indicator of overall performance, so they should only be reviewed as a contextual reference.
Interaction Performance by Post
Much like top-performing posts, reviewing how different types of posts performed based on reactions, comments, and shares allows you to identify which topics resonate most strongly with the audience. They can be used for content planning, but they don’t give you a clear understanding of your performance.
Use My Proprietary LinkedIn Metrics Framework to Get a Clearer Picture of What Truly Matters

Most executives measure only the metrics we touched on above because they’re familiar and easy to gather. However, as you can see, they’re all heavily influenced by things like the size of your follower count and posting cadence.
To address this, I’ve personally developed custom metrics that normalize the data, give a clearer picture of what truly matters, and make it easier to gauge the health of your LinkedIn presence.
Content Efficiency Score
CES is used to measure the true reach and performance of your LinkedIn content. This score eliminates the effects of posting frequency and follower count, so you can compare content quality month over month with accuracy. Focusing on it ensures that your content effectiveness improves independently of changes in posting frequency or follower growth, validating that your thought leadership aligns with your strategic objectives.
Content Efficiency Score Formula
(Total Impressions ÷ (Posts x Followers)) x 1,000
Your CES shows how effectively each post generates visibility relative to its audience size. A higher score means the content is resonating strongly and being distributed well by LinkedIn’s algorithm, regardless of how many posts are published or how fast the follower count grows. A strong score signals that your message and positioning are effective, which helps elevate brand perception. Aim for a content efficiency score of 250 or greater as a working benchmark for your executive profile.
Curiosity Rate
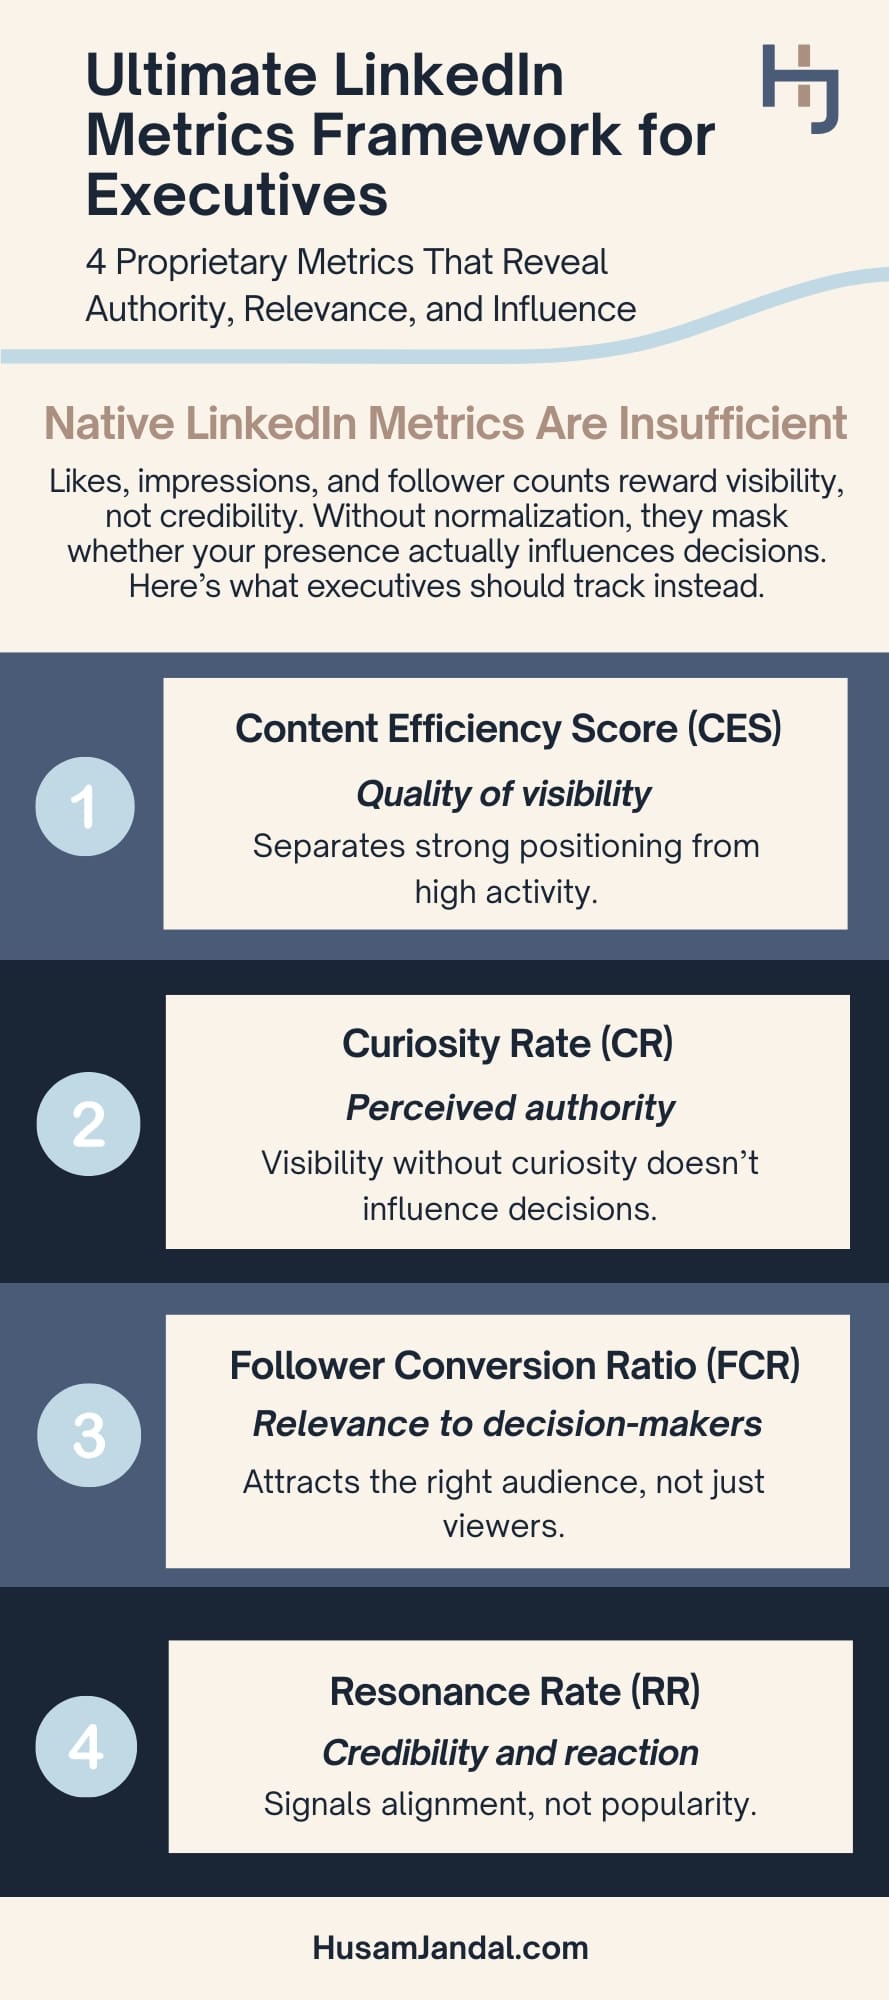
Curiosity rate (CR) evaluates how effectively the content converts visibility into genuine interest. It shows how many people were curious enough to click your profile after seeing your posts, which makes it a strong indicator of authority, relevance, and leadership impact. This metric is one of the clearest indicators of executive influence and signals that your perspective is compelling enough to warrant further exploration by senior decision-makers.
Curiosity Rate Formula
Total Profile Views ÷ Total Impressions
If impressions increase but profile views don’t, it suggests visibility is broad, but not compelling or authoritative enough. If impressions remain stable but profile views increase, it suggests content is resonating more deeply with the ideal customer profile (ICP) and decision-makers, reinforcing the trust and credibility necessary during early-stage vendor evaluation and request for proposal (RFP) consideration. For executive profiles, aim for a curiosity rate of one percent or greater.
Follower Conversion Ratio
Your follower conversion ratio (FCR) measures how effectively your content converts visibility into new followers. It tracks follower growth by impressions and avoids distortions caused by posting frequency or audience size. A high FCR is critical for establishing and maintaining sustained market visibility and authority with senior decision-makers, contributing directly to an elevated brand perception.
Follower Conversion Ratio Formula
(New Followers ÷ Total Impressions) × 1,000
If your FCR is high, it suggests your content is resonating with the right audience and compelling enough to convert passive viewers into active followers. If it’s low, the content is being seen, but not persuasive, differentiated, or authoritative enough to prompt people to follow. This measure reveals the true efficiency of your audience expansion, which is essential for ensuring your thought leadership reaches and influences the target market. An ideal FCR target for an executive profile is five per 1,000 impressions or greater.
Resonance Rate
Resonance rate (RR) measures how effectively your content motivates your audience to interact. This ratio reflects the level of relevance, resonance, and value the posts create for viewers. This rate serves as one of the platform’s strongest authority signals, confirming that your thought leadership is a credible and valuable voice worth responding to.
Resonance Rate Formula
(Total Reactions + Comments + Shares) ÷ Total Impressions
Note that, unlike LinkedIn’s native metric, impressions here are used as a denominator intentionally to normalize distribution, ensuring the metric reflects how compelling the content is to those who actually see it.
Higher resonanceindicates stronger alignment with ICP interests and signals to LinkedIn’s algorithm that the content deserves wider distribution. When your audience interacts with your content, it amplifies your reach and enhances the trust and credibility necessary for strategic influence. A resonance rate of more than two percent on your executive profile is ideal.
Get Help Moving Past Vanity Metrics and Improve Your Digital Marketing Holistically
No matter which aspect of digital marketing is being discussed, it’s essential to cut through the clutter and focus on the metrics that matter. This allows you to root your strategy in meaningful data, so your efforts produce the best possible results. But as you can see here, the most helpful metrics may not be provided directly through the platforms you’re using or even through third-party software. If you’d like help bringing this level of clarity to your overall digital marketing strategy, connect with me for a complimentary consultation.
FAQs on Measuring Personal LinkedIn Presence as an Executive
What is the Content Efficiency Score (CES), and what is the formula?
The Content Efficiency Score (CES) is used to measure the true reach and performance of your LinkedIn content. The formula is: (Total Impressions ÷ (Posts × Followers)) × 1,000.
What is a good target Content Efficiency Score (CES) on LinkedIn?
An ideal target Content Efficiency Score (CES) is 250 or greater.
How is the Curiosity Rate used to measure executive influence on LinkedIn?
The Curiosity Rate evaluates how effectively content converts visibility into genuine interest by tracking how many people click your profile after seeing your posts. It is considered one of the clearest indicators of executive influence, signaling that the content creator is seen as a credible, relevant leader whose perspective warrants further exploration.
What is the formula for calculating the LinkedIn Curiosity Rate?
The formula for the Curiosity Rate is: Total Profile Views ÷ Total Impressions.
What does a low Curiosity Rate indicate?
If impressions increase but profile views do not, a low Curiosity Rate suggests visibility is broad, but the content is not compelling or authoritative enough to motivate further interest.
Why should I use the Follower Conversion Ratio (FCR) instead of follower count?
Follower count alone is considered a vanity metric. The Follower Conversion Ratio (FCR) reveals the true efficiency of follower growth by tracking new followers per impression, avoiding distortions caused by posting frequency or audience size.
What is the formula for the Follower Conversion Ratio (FCR)?
The formula for the Follower Conversion Ratio (FCR) is: (New Followers ÷ Total Impressions) × 1,000.
What does a high Resonance Rate signal to LinkedIn’s algorithm?
Higher resonance indicates a stronger alignment with the interests of the Ideal Customer Profile (ICP) and signals to LinkedIn’s algorithm that the content deserves wider distribution.
What are examples of Informational Insights that are not performance metrics?
Informational Insights that provide context but are not used for performance measurement include Profile Views, Content Impressions, and Follower Growth.
How do I measure my authority and influence on my personal LinkedIn profile?
To measure your profile's authority, focus on enhanced metrics, not vanity indicators. The Curiosity Rate evaluates how effectively content converts visibility into genuine interest and is a clear indicator of executive influence. You should also track the Resonance Rate, which signals credibility to the algorithm.
What are the best metrics for measuring personal thought leadership performance on LinkedIn?
The most meaningful measures normalize data to track content quality and relevance. Use Content Efficiency Score (CES) to measure true reach and Follower Conversion Ratio (FCR) to track efficient audience growth. These metrics eliminate distortions from posting volume.