 How much should you spend to acquire a new customer? Retain one? The answer will differ for each business and often for each persona, but one thing is certain: most businesses undervalue this figure. As a result, they don’t grow nearly as quickly or meet revenue targets that would otherwise be a breeze. Reverse engineering changes how you view your digital marketing investments and helps you allocate funds in a data-driven way. I’ll walk you through how to reverse-engineer your digital marketing budget below.
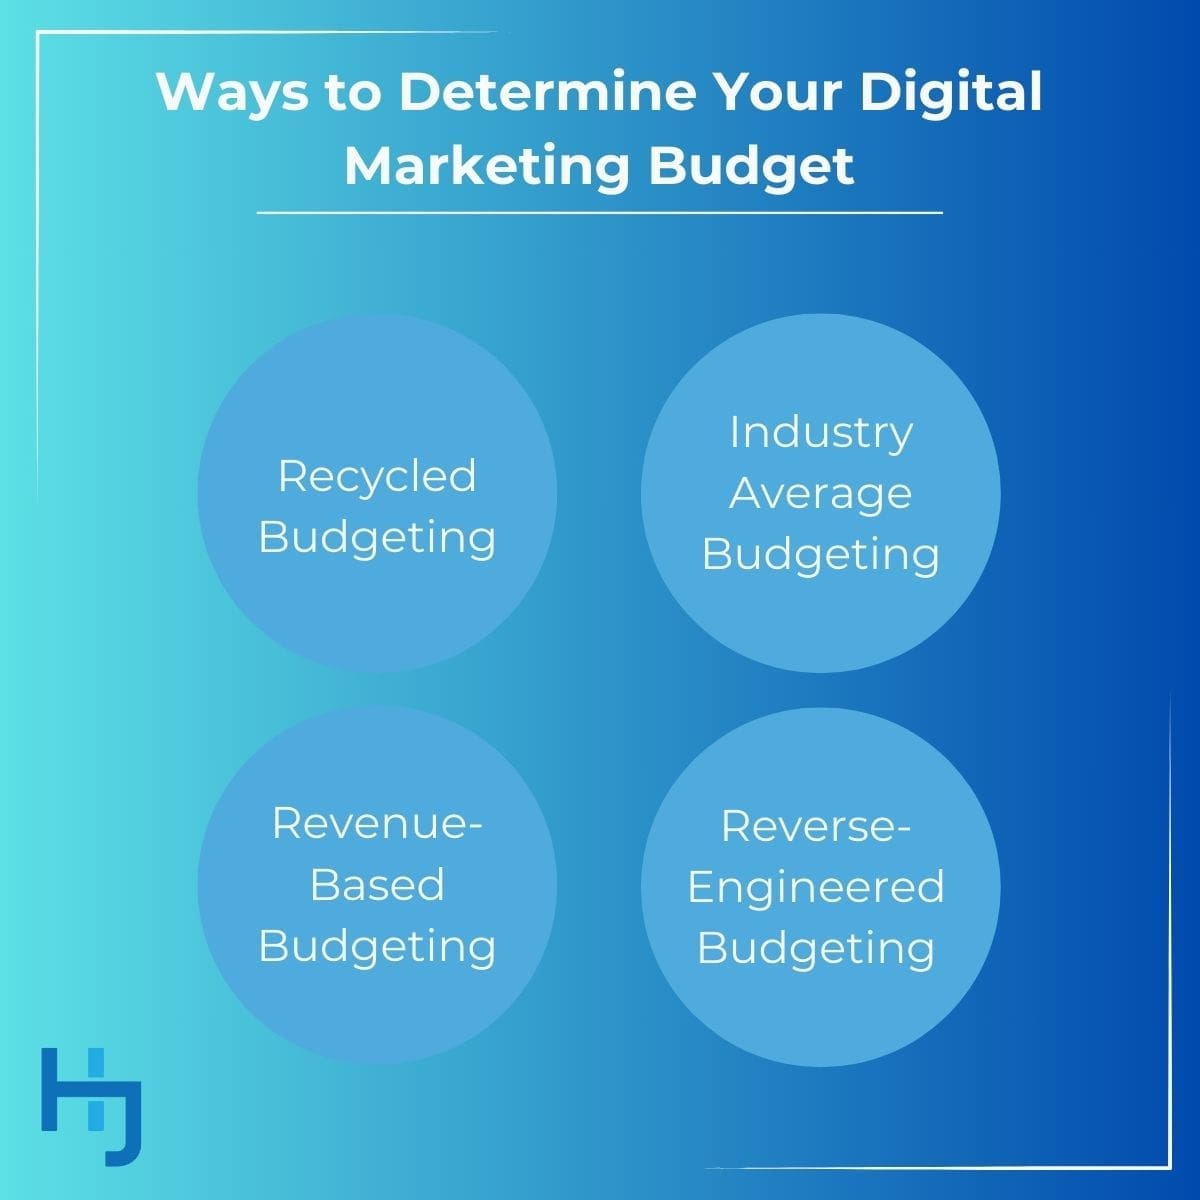
Ways to Determine Your Digital Marketing Budget
As a digital marketing and business consultant and Google Partners educator, I’ve seen businesses and marketers use a variety of tactics to determine digital marketing budgets. I’ll quickly review them below so it’s easier to see how the reverse engineering methodology differs and why it matters.
Recycled Budgeting
Oftentimes, businesses simply put their digital marketing budgets on autopilot by recycling the same figures they used in the prior year. While it’s a quick and easy way to set a budget, it’s neither strategic nor data-driven.
Revenue-Based Budgeting
Many sources say putting ten percent of your revenue toward digital marketing is best. Average spend is actually around nine percent for all marketing activities, Gartner reports. This is also a quick method but doesn’t account for things that distinguish your business from others.
Industry Average Budgeting
Various surveys provide insights here. For instance, marketing budgets per HubSpot are as follows:
- Finance: 8%
- Energy: 1%
- Healthcare: 18%
- Manufacturing: 13%
- Real Estate: 8%
- Service Consulting: 21%
- Transportation: 6%
While it can be helpful to know what businesses like yours spend on digital marketing, this method doesn’t address unique niches within industries, stages of growth, goals, and other factors.
Reverse-Engineered Budgeting
Reverse engineering allows you to work backward using your actual data and goals to determine your budget. It flips the paradigm and changes the way you look at budgeting. You’re not trying to make the most of what you have or are given. You’re identifying where you want to go and what it will take to get there. This is the method you’ll learn below.
Data You’ll Need to Reverse-Engineer Your Digital Marketing Budget
Reverse engineering is a data-driven approach, so you’ll need to gather information from your customer relationship management (CRM) software and analytics program. Required figures include customer lifetime value (CLV), target return on digital marketing spend, cost per acquisition (CPA), and average order value (AOV).
Simplified CLV
Customer lifetime value (CLV), sometimes called lifetime value (LTV), is the total amount of money you earn from a customer throughout your entire relationship.
I cover multiple ways to calculate CLV in “Customer Lifetime Value (CLV): What it is & Why it Matters.” However, most CLV formulas overlook the most significant revenue-driving factor of a happy customer—referrals! With that in mind, I typically recommend businesses leverage my simplified CLV formula.
To calculate CLV, you’ll need to know:
- Tenure: Average customer tenure in cycles in months or years.
- Volume: Average customer purchase volume per cycle.
- Referrals: Average number of new referred customers from each existing customer.
Simple CLV Alternate Formula
(Tenure) x (Volume) = A
(Referrals) x (A) = B
A + B = CLV
Simple CLV Calculation Example
To put this into action, let’s say a typical customer stays with your company for 36 months and spends $800 each month during their time with you but also refers three new customers. Your formula will be:
- (36 months) x ($800) = $28,800
- (3) x ($28,800) = $86,400
($28,800) + ($86,400) = $115,200; your CLV is $115,200
Target Return on Digital Marketing Investment
Target return on marketing investment (ROMI), sometimes referred to as target return on digital marketing spend, refers to how much money you want your business to generate in relation to how much you spend.
It’s often said that a ratio of 5:1, which represents 500 percent ROMI, or $5 for each $1 spent, is acceptable, while 10:1 is excellent. I advise brands to aim high but also recognize that many factors play into this figure, and continuous optimization of your marketing campaigns is required to reach peak performance. Because of this, it may be better to calculate your current ROMI and then raise the bar a little to ensure you’re working with achievable figures.
To calculate ROMI, you’ll need to know:
- Spend: The total amount of money spent on marketing efforts, typically per channel.
- Sales: The total amount of sales that can be attributed to your digital marketing efforts.
ROMI Formula
(Sales Attributed to Digital Marketing Channels) – (Digital Marketing Cost) = A
(A) ÷ (Digital Marketing Cost) = ROMI
ROMI Calculation Example
To put this into action, let’s say you generate $40,000 in sales from digital marketing each month and spend $5,000. Your formula will be:
($40,000) – ($5,000) = $35,000
($35,000) ÷ ($5,000) = 7; ROMI is 7:1; 700 percent, or $7 for each $1 spent
Cost per Acquisition
Cost per acquisition (CPA), sometimes referred to as customer acquisition cost (CAC), is the total amount of money your business spends to attract a new customer. You can calculate a general CPA for all your digital marketing activities or break it down by channel.
To calculate CPA, you’ll need to know:
- Spend: The total amount of money spent on marketing efforts, typically per channel.
- Conversions: The number of people who become customers.
CPA Formula
(Spend) ÷ (Conversions) = CPA
CPA Calculation Example
To put this into action, let’s say you’re spending $30,000 monthly on pay-per-click ads, and five people purchase your product. Your formula will be:
($30,000) ÷ (5) = $6,000; your CPA is $6,000
Average Order Value
Average order value (AOV) is your business’s average revenue from each order.
To calculate AOV, you’ll need to know:
- Revenue: Total revenue generated in a period.
- Number of Orders: Total orders generated during the same period.
AOV Formula
(Revenue) ÷ (Number of Orders) = AOV
AOV Calculation Example
To put this into action, let’s say your company generated $1,600,000 last year and processed 4,000 orders. Your formula will be:
($1,600,000) ÷ (4,000) = $400; your AOV is $400
How to Reverse-Engineer Your Digital Marketing Budget
Now that we’ve covered the background, let’s walk through the steps involved in reverse-engineering a digital marketing budget.
Step 1: Collect Your Numbers
Collect the figures we reviewed earlier on this page, including your:
- Customer lifetime value ($115,200)
- Return on digital marketing spend (700 percent)
- Cost per acquisition ($6,000)
- Average order value ($400)
You’ll also want to have figures that contribute to these numbers available, including annual revenue ($1,600,000), and know what the company-wide goals for the coming period entail.
Note that I’ve included the sample figures from our earlier examples in parenthesis so we can carry them through to the examples below.
Align Digital Marketing with Sales and Business Goals
Ideally, overall goals will be determined by company leadership at an executive level, which is why this stage only involves obtaining your goals rather than creating them. However, if you’re also responsible for determining the overall goals for digital marketing, it’s essential to think of it as it relates to marketing and the business as a whole. Any goal you set for digital marketing must be in alignment with company-wide and sales goals.
A typical business increases revenue by 2.8 percent annually, per McKinsey. High-performing companies grow ten to 22 percent each year. If you’re genuinely committed to growth and investing in it, your company goal should be on the higher end.
Our examples below assume the company-wide revenue growth goal is 15 percent and that digital marketing is responsible for producing ten percent growth.
Step 2: Review Your Revenue Optimization Tactics
Most businesses will focus on attracting new customers to boost revenue. This is only one potential method, as explored in “Revenue Optimization: How to Unlock Your Business’s Potential.”
Revenue Optimization Approaches
- Acquisition: Gaining new customers.
- Retention: Increasing the length of time a customer stays with you and makes repeat purchases.
- Expansion: Cross-selling and upselling.
- Pricing: Identifying a suitable pricing model and the sweet spot for pricing.
Based on what we know so far, our company generated $1,600,000 last year, and digital marketing is responsible for generating ten percent growth, which amounts to $160,000. The question then becomes which revenue optimization “levers” we want to pull to reach that $160,000 target.
Step 3: Reverse-Engineer Your Potential Figures
Now that we know where we’re going, it’s time to determine which “levers” to pull or how we want to get there. We’ll reverse-engineer our numbers for each revenue optimization category to better understand what it will take to reach the goal.
However, it’s important to note that these examples assume our efforts begin producing full results at the start of the year. That doesn’t happen in the real world, so we’d likely set these as targets to meet by the end of the first or second quarter and continue building on them throughout the year.
Acquisition Need
Based on our prior figures, we know that the average lifetime value of a customer is $115,200 over 36 months. This includes the value of referrals, not just the sales value.
Acquisition Need Formula
(Customer Lifetime Value) ÷ (Tenure in Months) = Monthly Revenue per Customer
(Monthly Revenue per Customer) x (12 months) = Annual Revenue per Customer
(Target Annual Revenue Increase) ÷ (Annual Revenue per Customer) = Total Acquisition Need
Acquisition Need Example
($115,200) ÷ (36 months) = $3,200
($3,200) x (12) = $460,800 = $38,400
($160,000) ÷ ($38,400) = 4.16; we need to acquire five customers to meet our revenue goal
Retention
Calculating retention need is unique because you can increase the number of customers retained and the length of the retention. In this example, we’re focusing on the average retention rate.
Retention Need Formula
(Customer Lifetime Value) ÷ (Tenure in Months) = Monthly Revenue per Customer
(Target Annual Revenue Increase) ÷ (Monthly Revenue per Customer) = Total Additional Months Need
(Total Additional Months Need) ÷ (Total Active Customer Base) = Retention Increase Needed
Retention Need Example
($115,200) ÷ (36 months) = $3,200
($160,000) ÷ ($3,200) = 50 months
(50) ÷ (2,000) = 0.025 months per customer; we need to increase average retention to 36 months and one day to meet our goal
While this figure may be enough for most businesses to work with, you can also zero in on a specific group of customers. Retaining an existing customer for an additional three months results in $6,400 revenue growth. Because of this, we can also reach our goal by encouraging 25 customers to stay with us for an additional three months.
Expansion
Expansion refers to increasing the value of each customer by upselling or cross-selling. We’ve established that our average order value is $400, and the typical customer orders twice monthly. In our example below, we’re encouraging existing customers to sign up for an add-on service valued at $100 per order, thus increasing revenue by $200 per month or $2,400 annually.
Expansion Need Formula
(Target Annual Revenue Increase) ÷ (Additional Annual Revenue per Customer) = Total Expansion Needed
Expansion Need Example
($160,000) ÷ ($2,400) = 66.67; we need 67 customers to sign up for the additional service to meet our target
Pricing
Our example below assumes that each time a customer places an order, they’re purchasing our core product, which costs $400 per order. They order twice per month.
Pricing Need Formula
(Target Annual Revenue Increase) ÷ (Units Sold Annually) = Total Price Per Order Increase Needed
Pricing Need Example
($160,000) ÷ (4,000) = $40; each order must increase by $40
It’s important to note that businesses must be strategic with pricing increases. Even small increases can result in the loss of customers. Remaining competitive helps reduce the loss but won’t always eliminate it. In this case, customer pricing would increase from $400 to $440 per order, which is a ten percent increase. An increase of this nature would likely result in a significant loss of customers, so it would not be advisable in most cases. It’s for illustrative purposes only.
Step 4: Create a Revenue-Specific SMART Goal
 At this stage, we know our overall goal and understand various ways to reach it. Our next step is to turn this information into a SMART goal.
Smart Goals Framework
The SMART goal framework involves creating goals that are:
- Specific
- Measurable
- Attainable
- Relevant
- Timebound
SMART Goal Example
A digital marketing SMART goal might be something like:
- “Produce ten percent ($160,000) year-on-year revenue growth this fiscal year by attracting four new customers per quarter/ 16 customers annually.”
- “Produce ten percent ($160,000) year-on-year revenue growth this fiscal year by encouraging 67 existing customers to sign up for the add-on service per quarter/ 268 customers annually.”
- “Produce ten percent ($160,000) year-on-year revenue growth this fiscal year by increasing average customer retention by two days and customer cost by five percent.”
Step 5: Reverse-Engineer Your Digital Marketing Budget
Now that we have our goals, we need to determine how much it will cost us to reach them.
Acquisition
Reverse-Engineered Acquisition Budget Formula
(New Customers) x (Cost Per Acquisition) = Marketing Budget
Reverse-Engineered Acquisition Budget Example
(16) x ($6,000) = $96,000; a budget of $96,000 is required to meet our goal exclusively through acquisition
Retention
It costs anywhere from five to 25 times more to attract a new customer than to retain one, according to Harvard Business Review. Our example company can increase retention by investing $240 to $1,200 per customer.
Reverse-Engineered Retention Budget Formula
(Customers) x (Retention Cost) = Marketing Budget
Reverse-Engineered Retention Budget Example
(2,000) x ($240) = $480,000; a minimum budget of $480,000 budget is required to meet our goal exclusively through retention
While that may seem significant, our figures indicate that we spent $12 million to acquire those customers, so retention remains a worthwhile investment.
Expansion and Pricing
Expansion and pricing costs are highly dependent upon the techniques you leverage. For instance, some brands can increase their pricing in a matter of minutes, while others will need to spend a few days updating all marketing and sales assets.
Step 6: Confirm Value
We can reverse-engineer how much we can reasonably invest in our digital marketing efforts, too. To do so, you’ll need:
- Customer lifetime value
- Profit margin
- ROMI
Reverse-Engineered Maximum Budget Formula
(CLV) x (Profit Margin) = Breakeven
Reverse-Engineered Maximum Budget Example
($115,200) x (0.5) = $57,600
In our examples, we determined that our CLV was $115,200. Let’s say our profit margin is 50 percent. That means we can spend up to $57,600 per customer and still break even. While we certainly don’t want to spend all of it on digital marketing, knowing this value helps put our budgets in perspective. Investing $6,000 in acquisition and $1,200 in retention, for a total of $7,200 per customer, is a solid investment for this company.
You can also use ROMI and target ROMI to identify if your marketing initiatives are delivering the return you expect. In the early stages, you may simply confirm that your initiatives yield a positive return. As you optimize your digital marketing initiatives, you can focus more on increasing the return.
Get Help Reverse-Engineering and Maximizing Your Digital Marketing Budget
As you can see, a lot goes into establishing a growth-oriented digital marketing budget, and this doesn’t even include breaking up the budget into individual initiatives, such as SEO, PPC, and content marketing. If you’re not sure how to set up a digital marketing budget or allocate your resources effectively, let’s talk. Although I have experience supporting Fortune 100 companies, my greatest passion is helping small and mid-sized businesses that are eager to grow to reach the next level. Contact me for a complimentary consultation.


Husam Jandal
Husam Jandal is an internationally renowned business and marketing consultant and public speaker with a background that includes training Google Partners, teaching e-business at a master’s level, receiving multiple Web Marketing Association Awards, and earning a plethora of rave reviews from businesses of all sizes.
