Everything your marketing team does should be measurable. In many companies, that means looking at KPIs like how much it costs to acquire a new customer or lead, how many new leads any given campaign draws, or sales revenue generated. Still, what if you’re looking at these figures, and they seem ok, yet you have a gnawing feeling that you could be doing better?
That’s where other metrics come in, and the ones to measure vary based upon your goals. Below, I’ll give a quick overview of some of the most commonly used metrics used to measure marketing success and a few more businesses commonly overlook.
1. Sales Revenue Generated by Marketing
Perhaps the most fundamental measurement of your marketing success is how much revenue your marketing strategy generates for your business. Bear in mind, this is not the end-all, as many valuable marketing benefits aren’t represented in revenue. Brand awareness, for example, is a big one. Even still, you should have the processes in place to ensure you can measure the revenue your marketing is creating for your organization so you can funnel your investments into what’s really driving the business forward.
As a business consultant, this is an area I concentrate on. Digital marketing is a fantastic revenue grower, but you need to have an effective strategy and measure what really works for your organization to receive the benefits.
2. Return On Marketing Investment (ROMI)
ROMI, also known as ROI, goes hand-in-hand with revenue. It’s great if your marketing campaigns result in one million in sales, but if those sales cost two million to generate, it’s obviously not a good situation. However, as with revenue, it’s not a whole picture of success. There are many things that will contribute to overall growth that won’t necessarily be reflected in ROMI, and there are times when you have to spend a bit more upfront to develop long-term customers. Nevertheless, here is a simple method to calculate Return On Marketing Investment (ROMI): Marketing Generated Revenue / Marketing Spend.
3. Cost Per Lead
No matter how you reach people, there will always be a dollar amount it takes to attract each business lead. This is true whether you’re using traditional channels, such as print and radio, or digital marketing channels. Knowing the cost per lead allows you to budget more effectively and put your investments toward the activities that are producing the best results.
Inbound Marketing Lead Expenses
It’s easy to look at the cost-per-click (CPC), cost per acquisition (CPA) or customer acquisition cost (CAC) provided by your analytical software (such as Google Analytics), but it’s only a portion of the actual expenses involved in attracting a new lead. Include all overhead costs, software, technology, and labor to get a clearer picture.
Outbound Marketing Lead Expenses
Outbound campaigns have similar expenses too. Consider your overhead, labor, distribution, and advertising costs in your calculations.
4. Customer Lifetime Value
The calculation for customer lifetime value (CLV) will vary somewhat based upon your business model. Oftentimes, it’s the product of an average sale multiplied by the average number of purchases a customer makes in a year and the average retention time. In these cases, you may be able to increase CLV by reaching out to existing customers to discuss additional products.
Other business models involve subscriptions. In these cases, your CLV is the product of monthly subscription times the average retention rate. CLV can be boosted through customer loyalty programs and upgrading to the next tier of service.
Regardless of the methodology and business model, happy customers refer other customers to you, so this should be factored into your CLV calculations as well.
5. Traffic-to-Lead Ratio
Traffic is a KPI (key performance indicator) that almost everyone tracks. It’s simple, easy, and virtually any platform you might use will provide you with the metric. The problem is, all the website traffic in the world isn’t going to help if those visitors don’t eventually take action or if your website has a high bounce rate. Things, like signing up for your newsletter or downloading a whitepaper, make these visitors new leads, provided you have a system in place to capture their information. Phone calls, online contact forms, emails, live chat, and social media messaging are common methods used to capture leads.
A/B testing is a good way to improve your traffic-to-lead ratio. Simply make small tweaks to your page to see if it improves the conversion rate. Equally, you can watch your conversions alongside your traffic. If traffic climbs and conversions don’t, it usually means there’s a disconnect between what the visitor expects to find and what he does. It can also signify that there’s something off with the offer you’re presenting. A/B testing will help you get to the bottom of it as well.
Pro Tip: when you do A/B testing, only change up one element at a time, so it’s easy to identify which change people respond to. For example, on your A variant, you might offer guests a 25% discount, while on your B variant, you might offer guests something free. Other individual elements to experiment with are colors, verbiage, headings, length, and the type of social proof displayed.
6. Lead Progress Ratios
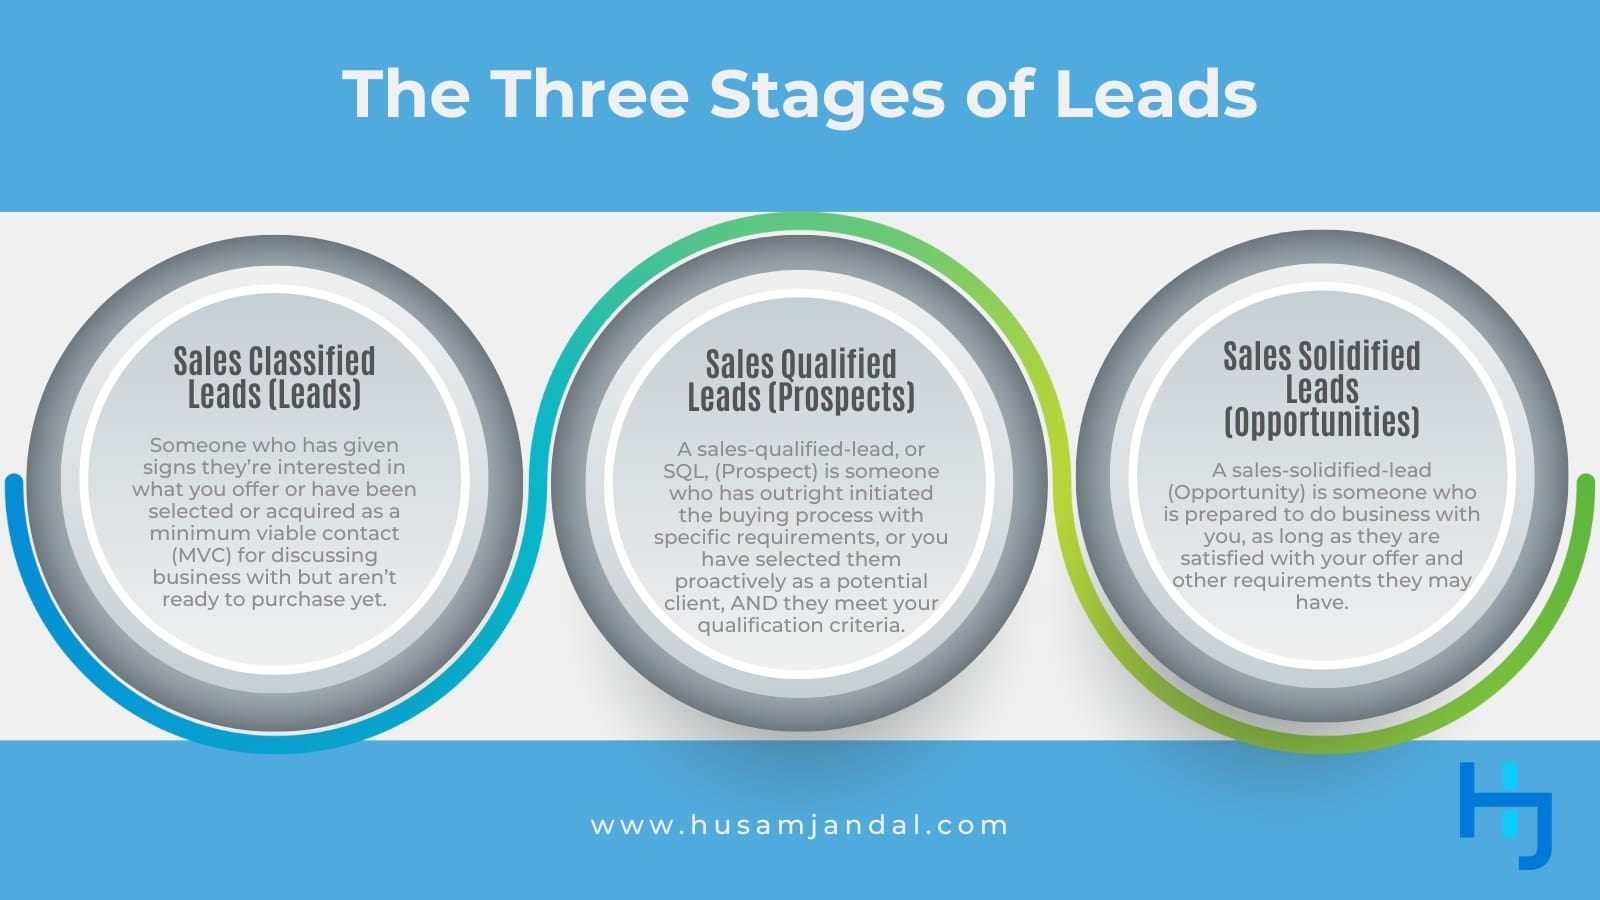
There are three stages for leads you’ll want to measure (Classify, Qualify, and Solidify); sales classified leads (Leads), sales qualified leads (Prospects), and sales solidified leads (Opportunities). The lead progress ratios will differ for each stage. Monitoring the numbers can help you identify if your sales team is getting the right leads from the marketing team, if the sales team is attending to these leads at the right time, and whether the sales team is doing an adequate job of advancing these leads to become customers.
Sales Classified Leads (Leads)
A sales-classified-lead (Lead) is someone who has given signs they’re interested in what you offer or have been selected or acquired as a minimum viable contact (MVC) for discussing business with but aren’t ready to purchase yet. Robust tracking systems can measure things like website engagement, the number of visits, and other metrics to provide you with a list of potential customers. People who make their way onto one of these lists will typically need a little more TLC to carry them through the sales funnel until they close as customers, so they shouldn’t be treated the same as those who are ready to take action. This stage is extremely essential to filter out irrelevant inquiries (such as those from vendors or job-seekers) from real Leads. Relevant metric: Cost-Per-Lead.
Sales Qualified Leads (Prospects)
A sales-qualified-lead, or SQL, (Prospect) is someone who has outright initiated the buying process with specific requirements, or you have selected them proactively as a potential client, AND they meet your qualification criteria. Perhaps they requested a consultation, analysis of their requirements, etc. These people are usually a lot easier to move forward in the sales process compared to marketing qualified leads (MQL) because they’ve done some research and/or meet your minimum qualification criteria. Relevant metric: Cost-Per-Prospect.
Sales Solidified Leads (Opportunities)
A sales-solidified-lead (Opportunity) is someone who is prepared to do business with you, as long as they are satisfied with your offer and other requirements they may have. Perhaps they requested a proposal or asked for a price estimate (the magical question: How Much?). These people are much more advanced in the sales cycle and will be ready to take action if the final offer matches their expectations. Relevant metric: Cost-Per-Opportunity.

7. Landing Page Conversion Rates
It may not need to be said, but anytime you’re advertising or giving people a special offer, that offer deserves its own landing page. That means people who click are sent to a page created expressly for their needs and designed to convert them or carry them through your funnel. They should never be sent to a standard webpage or your homepage.
Furthermore, the effectiveness of your landing page should be tracked, just like you track your traffic-to-lead ratio. If you’re already following best practices on your landing page and they’re not becoming leads, or you simply want to ensure you’re using the most effective landing pages possible, do A/B testing.
8. Organic Traffic
Organic search traffic drives 51 percent of traffic to average B2B and B2C sites, though the amount varies by industry. For example, business services usually get 73 percent of their direct visitors. Retail sits on the other end of the spectrum at little more than 40 percent. If your organization isn’t measuring up to industry standards, it’s time to explore what’s happening with your SEO (Search Engine Optimization) and whether you’re leveraging the right keyword strategy in order to optimize your search engine rankings and keyword rankings. Doing so means you’re getting optimal returns for unpaid campaigns and often minimizing your marketing expenses on the whole.
9. Social Media Metrics
Monitoring social media can seem a bit like opening Pandora’s Box. You’ve got followers/fans, impressions, clicks, engagement, shares, comments, and more for every single social media platform you’re on, such as Facebook, Twitter, and LinkedIn. I dig into optimizing your social media campaigns in other posts, but as a baseline, you should be tracking how much traffic you’re getting from each platform and your conversion rate for each platform. Doing so will make it easier to pinpoint which ones deserve resource investments and which ones you can let go of.
10. Inbound Link Performance
Technically speaking, links from social media count as inbound links to your site, but websites that perform best have a large portfolio of inbound links from other reputable sites as well. If article placement or press releases are part of your strategy, you may be able to get stats from these sources or Google Analytics to indicate which sources are performing. However, you’ll likely have an easier time tracking the performance of specific campaigns using UTM (Urchin Tracking Module) links. These specialized links readable by Google and other marketing platforms and contain tracking codes that make it easy to identify traffic sources.
11. Mobile Data

Google is indexing mobile versions of websites as a priority over desktop versions. The company has a good reason for this. 94 percent of people with smartphones use them to monitor and search for local information, and 77 percent of mobile searches occur at home or work, despite the fact that most people have desktop computers in these locations.
Your audience may be slightly different, especially if it focuses on the B2B niche. Even still, mobile traffic matters. Check into your analytics to see how much traffic comes from mobile sources and how user behavior differs from your desktop website visitors. Are you seeing more bounces or fewer conversions? It could be that your mobile experience is not up to par. Try to pinpoint what’s going wrong and adapt your site to meet the needs of mobile visitors better.
Get the Support You Need to Boost Marketing KPIs
Now more than ever, companies seek outside expertise to get the systems in place to bolster their success. As a business and marketing expert, I’ve seen the trend firsthand and personally know how big of a difference it can make to have a seasoned pro mapping out strategies and to identify which KPIs are best for any given organization and campaign. If your company isn’t sure which metrics to measure or you believe you should be getting better results than you are, contact me for a consultation.


